Defining Data Mining
By
This article is excerpted from the book Business Intelligence Roadmap: The Complete Lifecycle for Decision Support Applications (Addison-Wesley, 2003) by Larissa T. Moss and Shaku Atre.
Data mining is often confused with “writing lots of reports and queries,” when in fact data mining activities do not involve any traditional report writing or querying at all. Data mining is performed through a specialized tool, which executes predefined data mining operations based on analytical models.
Data mining is the analysis of data with the intent to discover gems of hidden information in the vast quantity of data that has been captured in the normal course of running the business. Data mining is different from conventional statistical analysis, as illustrated in Table 1. They both have strengths and weaknesses.
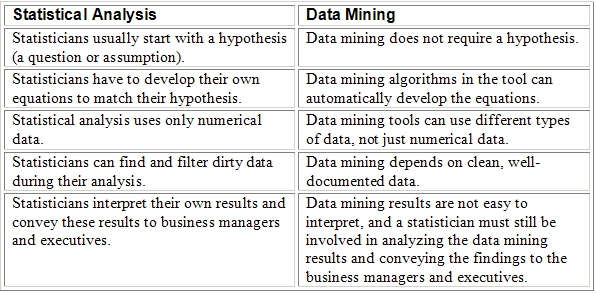
Table 1 Statistical Analysis vs. Data Mining
The following two examples further illustrate the difference between a traditional analysis approach and discovery-driven data mining. Table 2 is an example of insurance fraud, and Table 3 is an example of market segmentation.
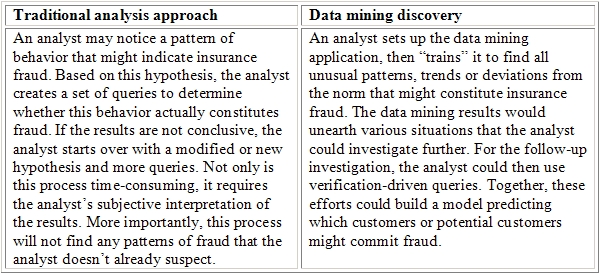
Table 2 Insurance Fraud Example
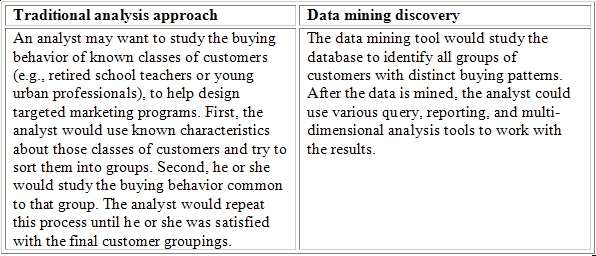
Table 3 Market Segmentation Example
Data Mining Data Sources
Data warehouse (DW) databases are popular sources for data mining applications because they contain a wealth of internal data from across business boundaries, which was gathered, consolidated, validated, and cleansed in the extract/transform/load (ETL) process. DW databases may also contain valuable external data, such as regulations, demographic, or geographic data, which when combined with internal organizational data offers a firm foundation for data mining.
However, once the data has been summarized for the DW, hidden data patterns, data relationships, and data associations are often no longer discernable from that data pool. For example, the tool may not be able to perform the common data mining task of market basket analysis with sales data, which was summarized by week, by product, and by store because some detailed data pattern about each sale may have gotten lost in the summary. Therefore, operational files and databases are also popular sources for data mining applications since they contain transaction-level detailed data with a myriad of hidden data patterns, data relationships, and data associations.
Data mining tools could theoretically access the operational databases and DW databases directly without building data mining databases first, as long as the database structures are supported by the tool (e.g. relational like Oracle, hierarchical like IMS, or even a flat file like VSAM). However, accessing operational and DW databases directly is not an advisable practice for several reasons:
-
The data pool needs to be able to change for the data mining tool, such as dropping a sales region or restricting a product type for specific mining purposes. Changing the data content of operational or DW databases is not possible.
-
The performance of operational as well as DW databases would be impacted by the data mining operations. That is unacceptable for operational databases, and not desirable for DW databases.
-
A data mining operation may need detailed historical data. Operational databases do not store historical data and DW databases often do not have the desired level of detail. Archival tapes may have to be restored and merged to extract the desired data.
It is therefore common that organizations extract data for data mining from their DW databases and from their operational files and databases as needed into special-purpose data mining databases, as illustrated in Figure 1.
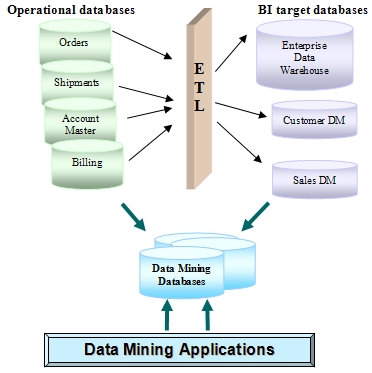
Figure 1 Sources for Data Mining Applications
Data Mining Techniques
Data mining techniques are specific implementations of algorithms which are used in data mining operations. There are six common data mining techniques.
Association
Association analysis is used to identify the behavior of specific events or processes. Associations link occurrences within a single event. An example might be the discovery that men who purchase premium brands of coffee are three times more likely to buy imported cigars than men who buy standard coffee brands.
Association analysis is based on the rule that specifies: If item A is part of an event then X % of the time (confidence factor) item B is part of the same event. Examples of association analysis may be:
-
If a customer buys snacks, there is an 85% probability that the customer will also buy soft drinks or beer.
-
If a person buys vacation airline tickets for an entire family, there is a 95% probability that he or she will rent a full-size car at the vacation location.
With the help of scanners, retail stores can develop hypotheses for buying patterns in grocery stores. Because of the context of a grocery store, association analysis is sometimes calledmarket basket analysis.
Sequence
Sequences are similar to associations, but they link events over time and determine how items relate to each other over time. For example, sequence discovery might predict that a person who buys a washing machine may also buy a clothes dryer within six months with a probability of 0.7. To increase their chances above the predicted 70% probability, the store may choose to offer a 10% discount on clothes dryers to all buyers of washing machines within three or four months after their washing machine purchase.
Classification
Classification is the most common use of data mining. Classifications look at the behavior and attributes of already determined groups. The groups might include frequent flyers, high spenders, loyal customers, people responding to direct mail campaigns, people with frequent back problems (people driving long distances every day). The data mining tool can assign classifications to new data by examining existing data that has already been classified and by using the results to infer a set of rules. The set of rules is then applied to any new data to be classified. This technique often uses supervised induction, which employs a small training set of already classified records to determine additional classes. An example of this use might be to discover the characteristics of customers who are, or are not, likely to buy a certain type of product. This knowledge would result in reducing the cost of promotions and direct mailings.
Cluster
Clusters can be used to discover different groupings within the data. This is similar to classification, except that no groups have yet been defined at the outset of running the data mining tool. The clustering technique often uses neural networks or statistical methods. Clustering divides items into groups based on the similarities the data mining tool finds. Within a cluster the members should be very similar, but the clusters themselves should be verydissimilar. Clustering is used for problems such as detecting manufacturing defects or finding affinity groups for credit cards.
Regression (Forecasting)
Regression is one of two forecasting techniques. It uses known values of data to predict future values or future events based on historical trends and statistics. For example, the sales volume of sports car accessories can be forecasted based on the number of sports cars sold last month.
Time Series (Forecasting)
The difference between Regression and Time Series is that Time Series forecast only time dependent data values. For example, it determines the rates of accidents during a holiday season based on the number of accidents that occurred during past years’ holiday seasons. The property of time can also include a hierarchy of time periods, such as work week vs. calendar week, holidays, seasons, or date ranges and date intervals.
Data Mining Operations
Data mining tools enable statisticians to build analytical models, which the tools use during data mining operations. A predictive engine will ask for a list of input criteria, and will follow the steps and relationships from the analytical model to determine the most likely predictions. The results of data mining operations are tables and files loaded with analysis data, which can then be accessed with query and reporting tools. There are four common data mining operations.
Predictive and Classification Modeling
Predictive and classification modeling is used to forecast a particular event. It assumes that an analyst has a specific question he or she would like to ask. The model provides the answer by assigning ranks, which determines the likelihood of certain classes. For example, if a bank wants to predict which customers are likely to leave, they have to prepare for predictive modeling by feeding data about two types of customers into the data mining tool: data of customers who have left and data of customers who have stayed.
The tool then sifts through the data to uncover the variables that identify classes of profiles of typical customers who leave and classes of profiles of typical customers who stay. The analysis results might be:
-
Customers over 40, who have an income greater than $150,000 per year, who are female, and who own their own home, have a 35% chance of leaving the bank.
Link Analysis
Link analysis finds relationships between database records. For example, link analysis can determine which items sell together (cereal and milk).
Database Segmentation
Database segmentation groups related records into segments. This grouping is often the first step of data selection, before other data mining operations take place. For example, database segmentation may group frequent flyer passengers and occasional passengers.
Deviation Detection
Deviation detection looks for records that fall outside the norm and suggests reasons for the anomalies. For example:
-
Customers that used to make frequent purchases but have not purchased anything in a long time were either transferred by their companies or have moved away from the area.
Conclusion
Most organizations are sitting on top of a gold mine, the “gold” being all the data collected about their customers and the products their customers buy. Embedded in this data are their customers’ styles of expenditure, their likes and dislikes, and other information about their buying habits. It is a wasted resource not to use this business intelligence hidden in the data. However, it is important to keep in mind that in spite of all the dazzling technologies, data mining has to be driven by strong business needs in order to justify the expenditure in time and money.
About the Author
Ms. Moss is founder and president of Method Focus Inc., a company specializing in improving the quality of business information systems. She has over 20 years of IT experience with information asset management. She frequently presents at conferences in the United States, Europe, and Asia on the topics of Data Warehousing, Business Intelligence, CRM, Information Quality, and other information asset management topics, such as data integration and cross-organizational development. She lectures worldwide on the topics of business intelligence, data warehouse development, project management, data modeling, as well as data audit and control. Ms. Moss is co-author of the books: Data Warehouse Project Management, Addison Wesley 2000; Impossible Data Warehouse Situations, Addison Wesley 2002; and Business Intelligence Roadmap: The Complete Project Lifecycle for Decision Support Applications, Addison Wesley, 2003. Her articles are frequently published in The Navigator, Analytic Edge, TDWI Journal of Data Warehousing, Cutter IT Journal, and DM Review.
She can be reached at methodfocus@earthlink.net